When Futurez tells you there’s an 89% chance your money lasts 30 years, that number is only worth something if the engine behind it is sound. You shouldn’t take our word for it. So we tested our simulation engine against the same published research that professional financial planners rely on, and we’re publishing the results, including the places where we don’t match.
What kind of number is this?
There are two ways to answer “will my retirement plan survive?”
Look backwards. Take the actual history of the U.S. market and replay it: how many real retirement start-dates would have survived? This is what the famous studies do — the Trinity Study, and Bengen’s original “4% rule.” It’s rigorous, and it’s the foundation of modern retirement planning. It also has a catch: the 20th-century U.S. market was unusually kind, and a backtest treats the luckiest run in developed-market history as the full range of possibility.
Look forwards. Simulate thousands of possible futures, including market sequences worse than any on record. This is what Futurez does, and it’s what the modern research firms do. It produces more cautious numbers, on purpose.
That distinction matters for reading everything below. If Futurez matched the backtests exactly, that would be evidence it was flattering you.
The headline
Morningstar publishes an annual study of the safe withdrawal rate — how much you can pull from your portfolio in year one, adjusted for inflation thereafter, and still have a 90% chance of lasting 30 years. It’s forward-looking, built on their own capital-market assumptions, and one of the most-watched numbers in the profession.
Morningstar’s 2026 figure is 3.9%. We ran the identical question through Futurez and landed a notch under it, at 3.7%. Two independently-built, forward-looking engines answering the same question. Futurez comes in slightly more conservative rather than more generous.
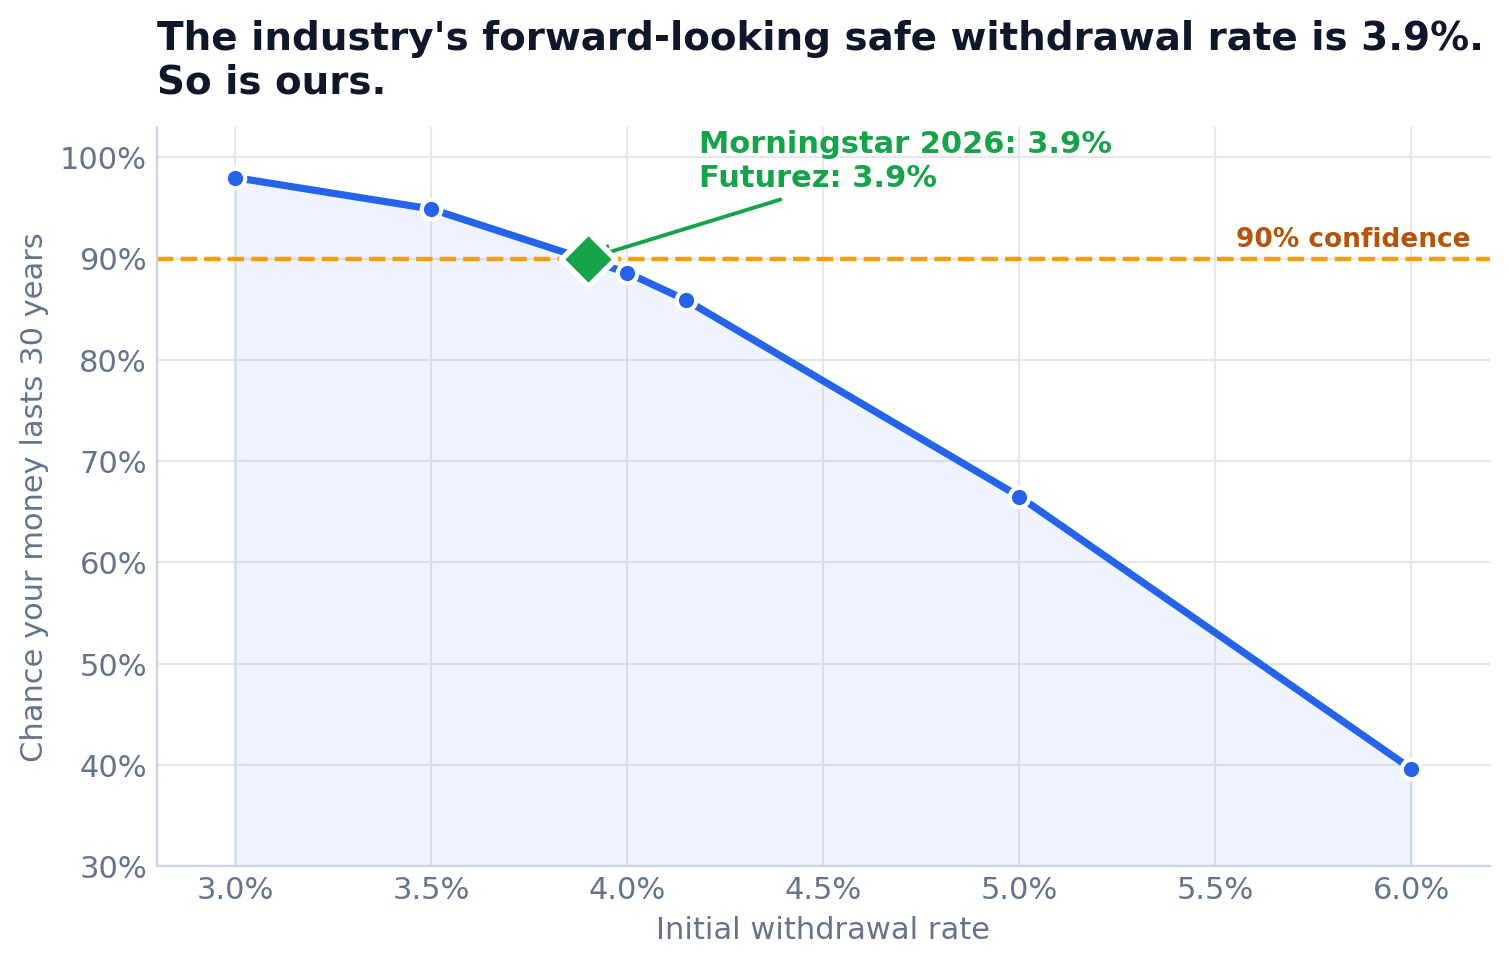
This is the most meaningful comparison we have — the only true like-for-like, two forward-looking engines on the same question, with no methodology confound between them. And Futurez sits just below Morningstar, on the cautious side: the closest thing to an apples-to-apples check we can run.
We also checked Vanguard’s retirement calculator, using their own published example ($1.5M portfolio, $60,000/year, 30 years). Vanguard reports 91%; Futurez reports 84%. Vanguard’s engine draws on historical returns, which places it between the two camps — and a gap in the cautious direction is exactly what that predicts.
We never flatter your plan
Across every published benchmark we tested, forward-looking and historical alike, Futurez lands at or below the published figure. Never above.
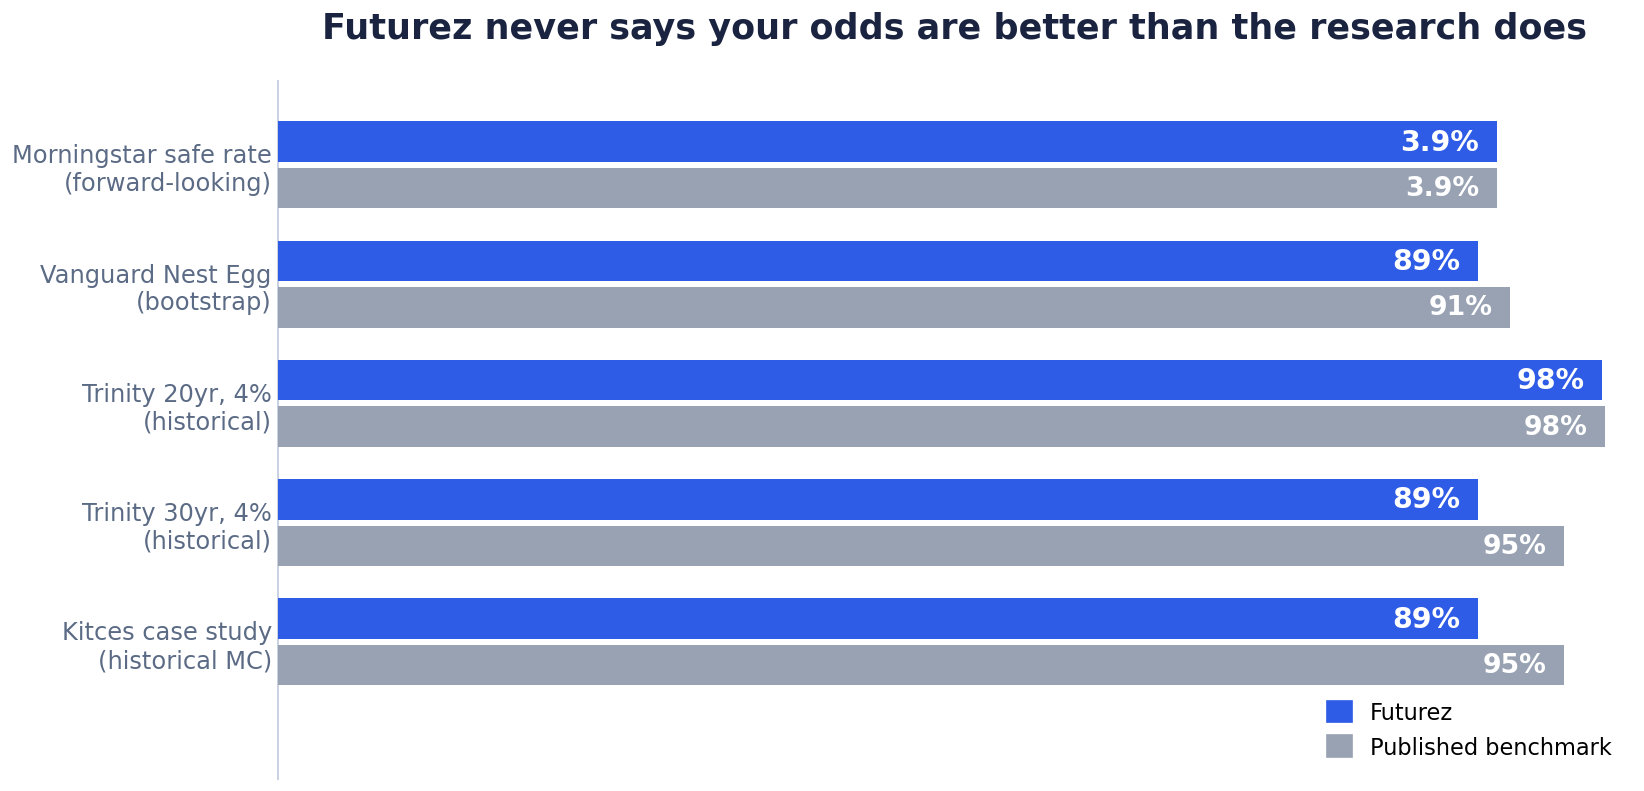
That’s the property that actually matters in a retirement plan. An engine that errs optimistic tells you to retire a year too early, or spend 10% too much, and you find out it was wrong at 82, when it’s too late to fix. We would rather be the tool that plays it a little safe.
Against the historical studies the gap is wider — and it widens in a very particular way. Against Trinity’s balanced 30-year 4% case, our results come out around 83% where the historical record says about 95%. We’re not going to explain that gap away. That gap is the whole point. It’s the difference between “this survived the 20th century” and “this survives most futures we can imagine, including bad ones.”
And the gap keeps growing as the portfolio tilts toward stocks: about 17 points below Trinity at a stock-heavy 75/25 mix, and about 19 points at an all-stock portfolio — the widest single gap in the suite. That’s not a random weak spot we’re being brave enough to show; it’s the most concentrated expression of what forward-looking means. The more equity you hold, the more your plan rides on the market’s worst sequences — and those are exactly the sequences a 20th-century backtest never had to survive. Where a plan is most exposed to the bad tails, a cautious forward-looking engine and a historical replay should disagree most, and here they do. We’re showing that rather than hiding it, because publishing the widest gaps is what makes the close matches credible.
Reproducing the relationships
Matching a single number could be luck. The stronger test is whether an engine independently rediscovers the shape of what the research shows.
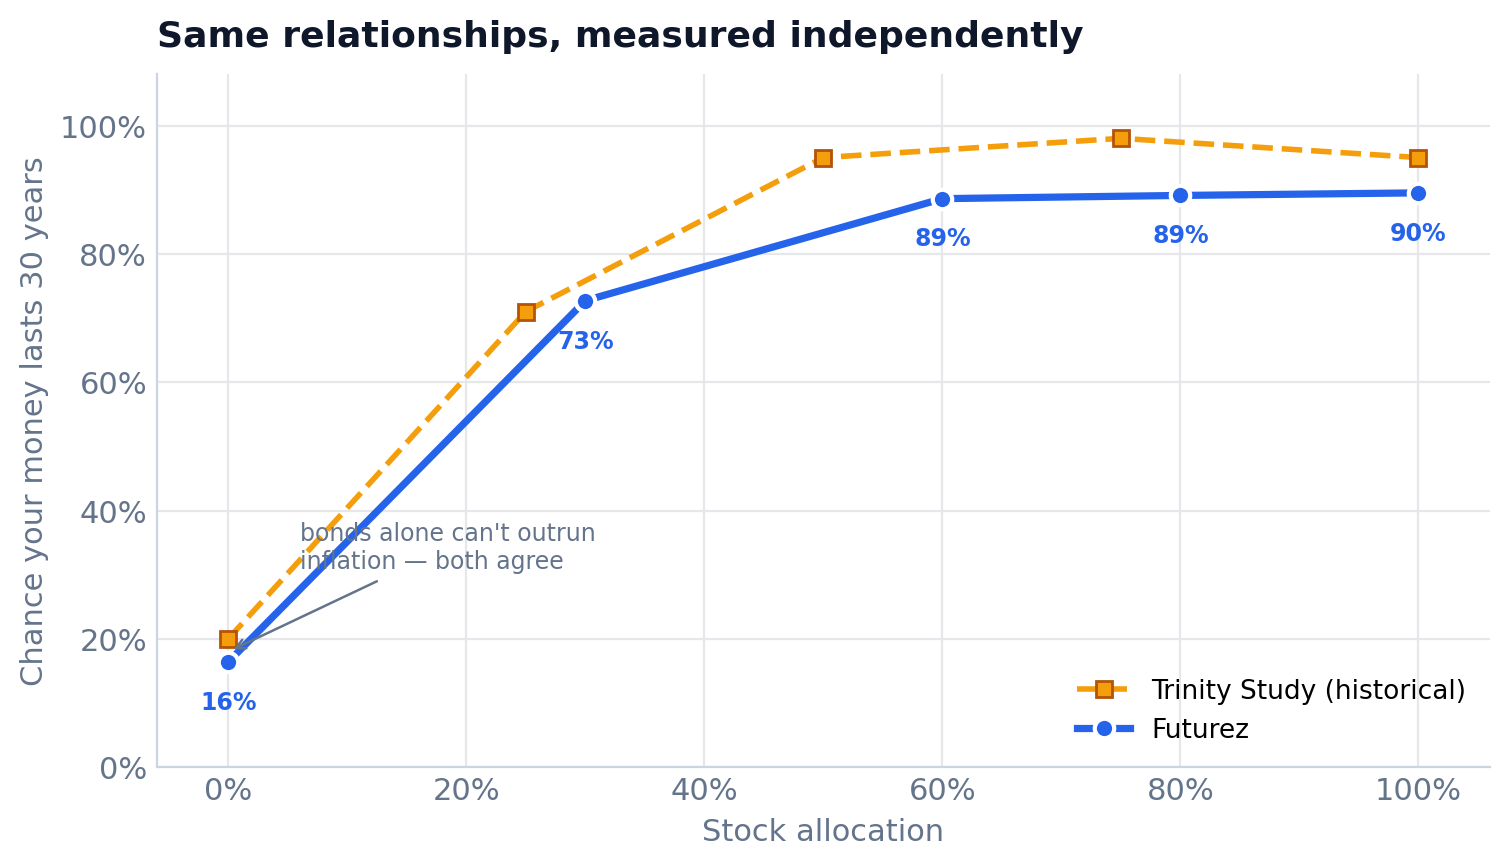
The Trinity Study found something that cuts against most people’s retirement instinct. The conventional move is to play it safe once you retire: shift out of stocks and into bonds so a market crash can’t sink you. But over a 30-year retirement with inflation-adjusted withdrawals, that “safe” choice is the riskiest one: a bond-heavy portfolio is the most likely to run dry, because its low returns can’t keep up with inflation while you draw an ever-rising income from it. Holding more stocks raises the odds your money lasts, but only up to a point, past which the extra volatility starts to cost you.
Futurez was not designed around this idea, yet it independently produces the same hump: the odds climb steeply from a bond-only portfolio (just 12%), rise to a peak, and then roll back off as you pile on more equity than a 30-year drawdown rewards. Two things set our curve apart from the backtest, and both point the same way. Our peak sits at a more balanced mix (83%) rather than at Trinity’s stock-heavy 75/25, and our roll-off past it is steeper (81% at growth, 76% at aggressive, against a nearly flat 95–98% across Trinity’s whole upper half). That’s the same divergence from the section above, drawn as a curve: a forward-looking engine marks down concentrated-equity portfolios because that’s where the worst sequences bite hardest, so its sweet spot lands earlier and its high-stock tail sits lower. Futurez rediscovers the shape of the relationship — bonds are worst, a sweet spot exists, too much equity stops helping — while placing that sweet spot where a cautious view of the future puts it, not where the luckiest century in history did.
The saving side
Everything above is about spending money down. Futurez also has to get building it up right.
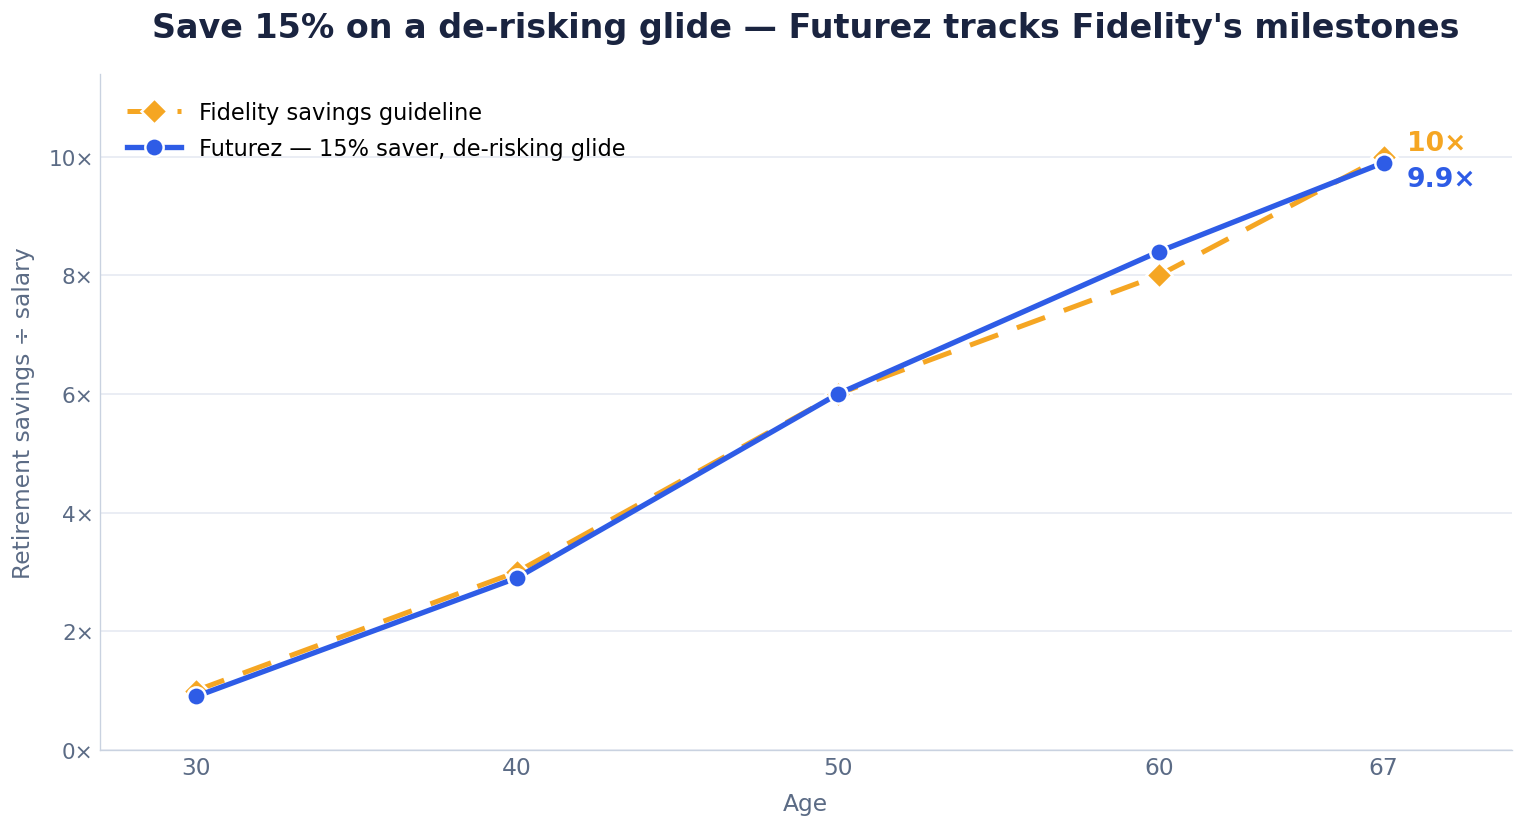
Fidelity publishes a well-known guideline: save 15% of your salary and you should have roughly 1× your salary saved by 30, 3× by 40, 6× by 50, 8× by 60, and 10× by 67. Those milestones assume a target-date approach, a portfolio that de-risks toward retirement, shifting from stocks into bonds as you age, so that’s what we modeled, rather than a fixed allocation.
Do that, and Futurez tracks the line almost the whole way: 0.9× / 2.9× / 5.8× / 8.5× / 9.9× against Fidelity’s 1× / 3× / 6× / 8× / 10×.
Two honest caveats. Fidelity’s milestones are a deliberately conservative planning target — a floor you’re meant to clear, not a forecast. And the glide we modeled is growth-oriented — heavier on stocks in the early years, de-risking toward bonds only as retirement nears — which is exactly how the target-date funds behind Fidelity’s own guideline are built. A saver who de-risked earlier or held a more cautious mix throughout would, in our model, finish somewhat below the milestones. Either way, a disciplined 15% saver on a sensible glide reaches the mark.
How the dice work
This is the property that makes Futurez worth using to actually decide something, not just to read a number.
Take a retiree drawing $40,000 a year with an 83% chance of lasting 30 years, and make one ordinary change: trim spending by $200 a month, roughly one dinner out a week, about a 6% cut. The chance of success rises to 89%.
The figure that matters there isn’t the 83 or the 89 — it’s the six-point gain. And you can trust it, because both versions of the plan are scored against the same 1,000 market futures. Nothing is reshuffled between runs; the only thing that changed is the spending. Because the markets are held fixed, that six-point gain is the decision at work, not a luckier draw — the same 1,000 futures faced both plans. Run either version again and you get the identical answer.
That guarantee is per plan. Every version of one simulation faces the same fixed 1,000 futures — which is exactly why editing a plan and re-running isolates your decision so cleanly. A separate simulation may draw a different 1,000, so weigh a change by editing one plan into new versions, not by building two plans side by side and comparing their headline numbers.
Contrast that with a simulator that draws fresh random markets on every run. There, the same good decision can make the number fall, not because it was a bad decision, but because a new roll of the dice happened to land worse, and you’d have no way to tell a real improvement from a reshuffle. Every success rate, ours included, carries a couple of points of sampling wobble. What Futurez does is keep that wobble out of the comparison, so a move of a few points is a signal you can act on.
So read the number the way it’s meant to be read: don’t agonize over 85% versus 87%. Ask what moves it, and trust what the tool tells you about the size and direction of that move. That’s the question a plan is actually built to answer.
How the engine is built
The benchmarks above test the engine’s output. Underneath them is a market model calibrated against roughly a century of U.S. market history, real returns, real crashes, real inflation, with volatility, fat tails, clustered downturns, and stock/bond behavior all tuned to match the record. On top of that, we deliberately mark near-term stock returns down toward the cautious forecasts that major asset managers publish today, because current stock valuations are historically high. In plain terms: the model’s behavior is grounded in history, and its near-term return outlook leans conservative on purpose.
What we’re not claiming
- These are probabilities, not promises. No simulation knows the future. A 90% plan fails one time in ten, and that’s the point of the number.
- Reproducible isn’t the same as certain. Your plan always scores the same, and that’s a real feature, but it doesn’t make the number exact. It’s still one model’s estimate, resting on assumptions about future returns, and those assumptions do the heavy lifting. That’s why we report whole percentages and never decimals: a decimal would be stable, but it wouldn’t mean anything.
- We didn’t match every benchmark, and we showed you the misses. Our gaps against the historical backtests widen as the portfolio tilts toward stocks, reaching about 19 points below Trinity at an all-stock allocation — the widest in the suite. That’s the forward-looking markdown of concentrated-equity risk, not an error, and we’d rather show it than bury it.
- Benchmark comparisons are approximate. Our portfolio settings don’t map perfectly onto the exact stock/bond mixes each study used, so a point or two of every difference above is that mismatch rather than the engine.
- This isn’t financial advice, and past performance, including 100 years of it, can’t guarantee future returns.
The bottom line
Tested against the retirement industry’s published research, Futurez comes in just under the leading forward-looking study, reproduces the shape the historical studies found in the allocation curve (a climb, a peak, a roll-off), tracks the industry’s savings milestones, and, on every single benchmark, never once claimed your plan was safer than the research says. That’s what we mean when we say you can trust the number.
See your own numbers
Build a plan, run it across 1,000 futures, and compare the decisions that matter most.
Start ModelingFrequently asked questions
How accurate is Futurez?
We benchmarked the engine against the retirement industry’s published research: Morningstar, the Trinity Study, Bengen’s 4% rule, Vanguard, and Fidelity. On the one true like-for-like comparison (Morningstar’s 2026 forward-looking safe-withdrawal-rate study) Futurez comes in a notch under, at 3.7% vs 3.9% — on the cautious side. Against every benchmark tested, it lands at or safer than the published figure. Never more optimistic.
Is a Monte Carlo retirement calculator accurate?
A Monte Carlo simulation is only as good as its market assumptions and its math. We validate both: our assumptions are calibrated to roughly a century of market history, and we maintain thousands of automated tests on all the meaty engine parts. No simulation predicts the future, these are probabilities, not guarantees, but the method is the same one professional planners and firms like Morningstar and Vanguard use.
Why is Futurez’s number lower than the 4% rule says?
Because the 4% rule (from the Trinity Study and Bengen’s work) is a backtest of 20th-century U.S. history, an unusually favorable run. Futurez is forward-looking: it simulates futures worse than anything on record, so it reads a few points more cautious on purpose. A forward-looking engine that matched the backtests exactly would be flattering you.
What is a safe withdrawal rate for 2026?
Morningstar’s 2026 study puts the starting safe withdrawal rate at 3.9% for a 30-year retirement with a 90% success target. Running the same question, Futurez arrives at 3.7% — a notch more cautious. Your own safe rate depends on your portfolio, horizon, and how much certainty you want, which is exactly what the simulator is for.
Does Futurez guarantee my plan will work?
No. Futurez models possible futures and reports the chance your plan succeeds across 1,000 market scenarios. A high number is reassuring, not a promise. The tool is deliberately built to lean cautious rather than optimistic. It is not financial advice.
Morningstar, “What’s a Safe Retirement Withdrawal Rate for 2026?” (3.9% base-case starting safe withdrawal rate, 30-year horizon, 90% success target). Vanguard Retirement Nest Egg Calculator, published example ($1.5M, $60,000/yr, 30 years). Cooley, Hubbard & Walz, “Retirement Savings: Choosing a Withdrawal Rate That Is Sustainable” (the Trinity Study). W. Bengen, “Determining Withdrawal Rates Using Historical Data,” Journal of Financial Planning (1994). Fidelity retirement savings-rate guidelines. Benchmark figures are the representative values reported in those sources.
Each Futurez figure is the result of 1,000 Monte Carlo trials on inputs reconstructed from the cited source. “Success” means the portfolio is never depleted over the stated horizon. Trials are deterministic — a given plan is always evaluated against the same 1,000 market scenarios — so every figure is reproducible, and differences between plans reflect the inputs rather than resampling. Results are reported as whole percentages because the underlying market assumptions, not the trial count, dominate the uncertainty. The engine’s math was additionally verified against an independently written 200,000-trial reference implementation, which it tracks within about three percentage points. Figures illustrate engine behavior and are not financial advice, a guarantee of future results, or a recommendation of any withdrawal rate or allocation.